
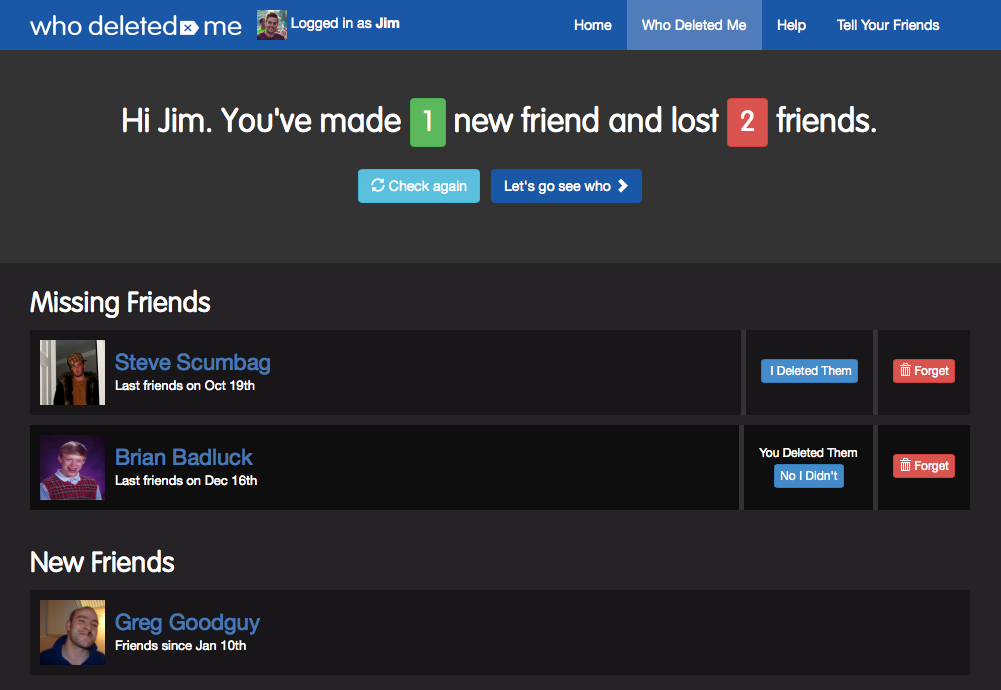
Who Deleted Me
App and browser extension showing who unfriended you on Facebook. #1 app in the App Store and on Google Play with massive viral attention. Used by over 2 million people.
App and browser extension showing who unfriended you on Facebook. #1 app in the App Store and on Google Play with massive viral attention. Used by over 2 million people.
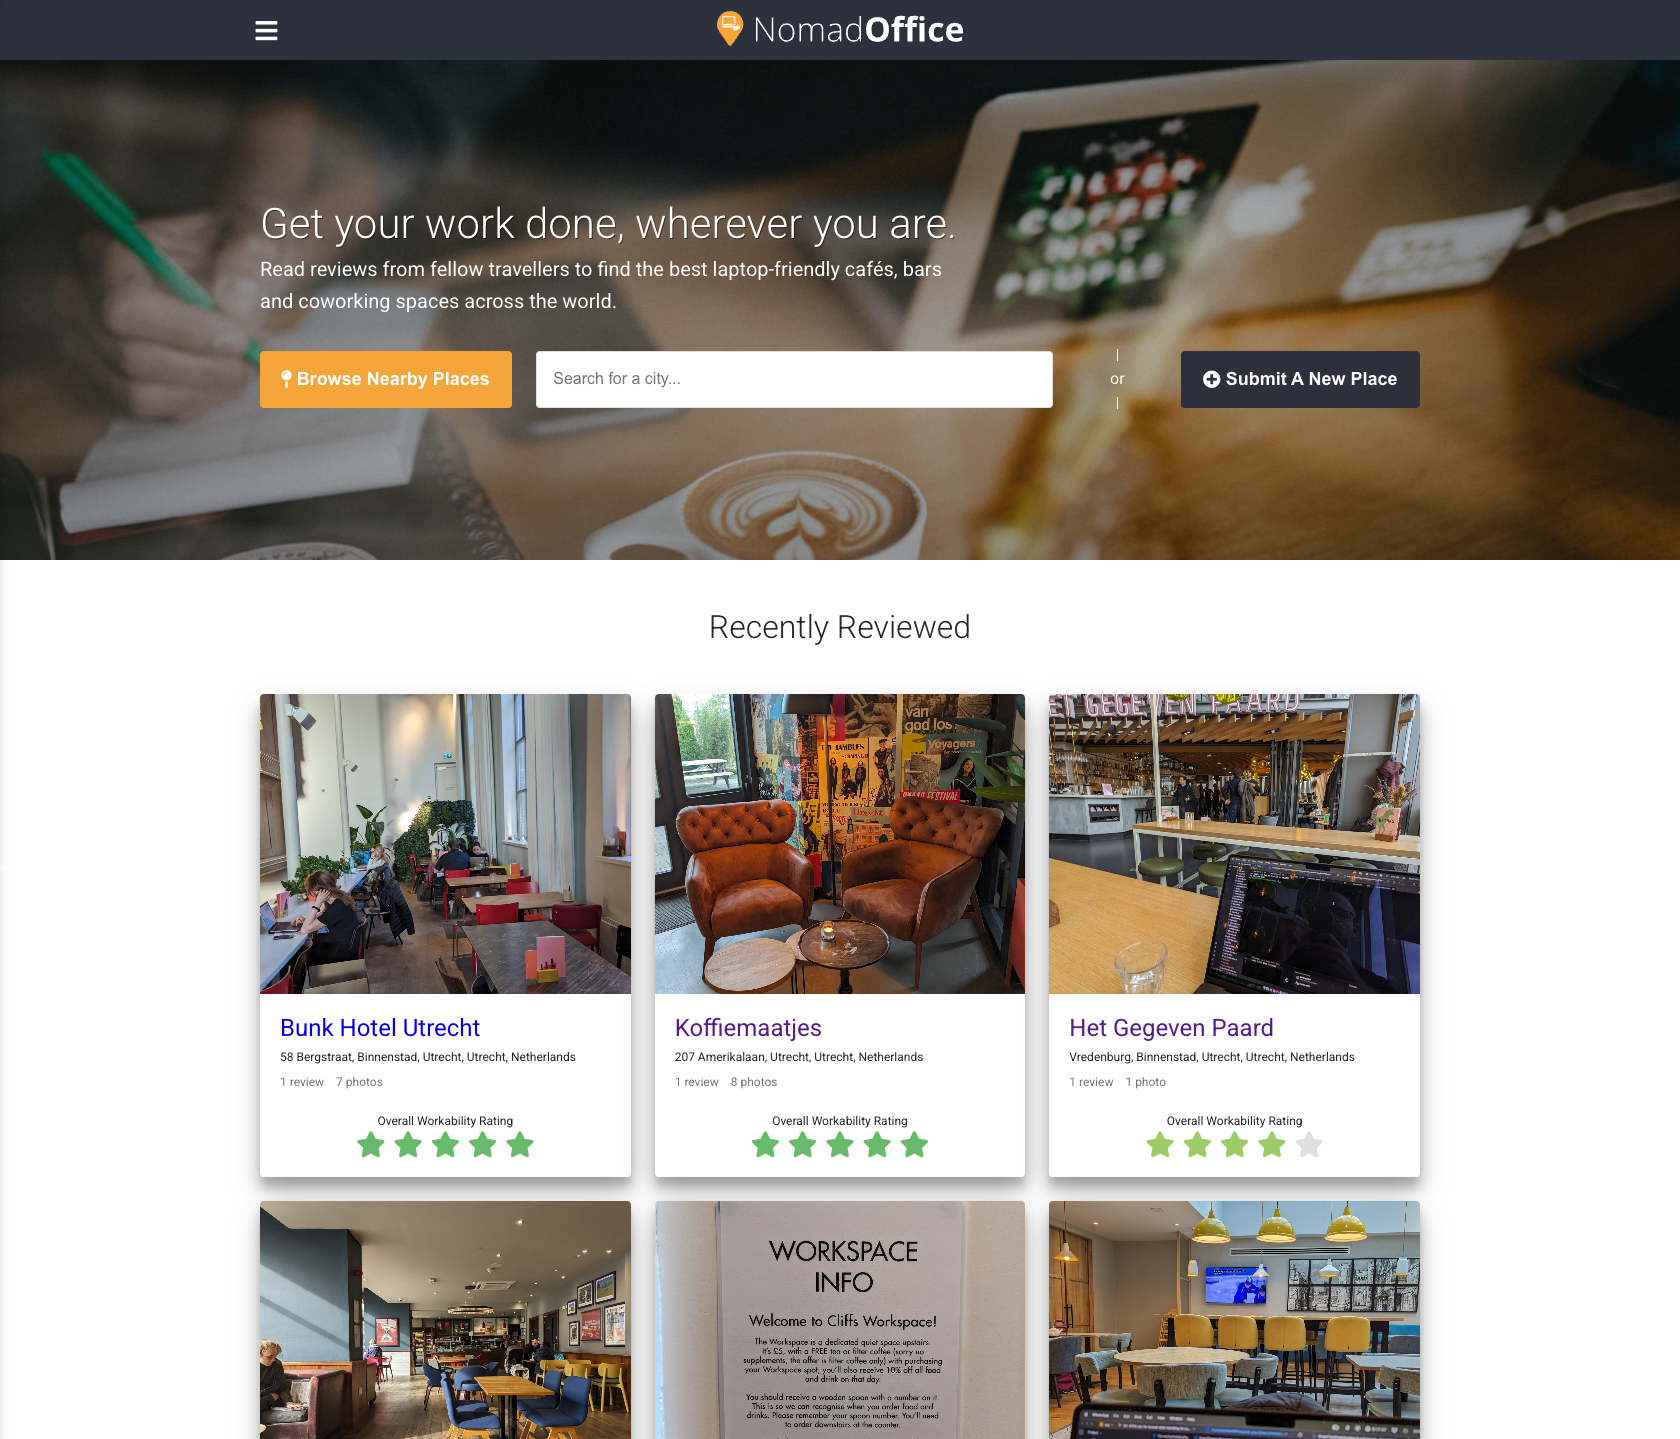
Directory for finding laptop-friendly cafes around the world. Built for digital nomads and remote workers.
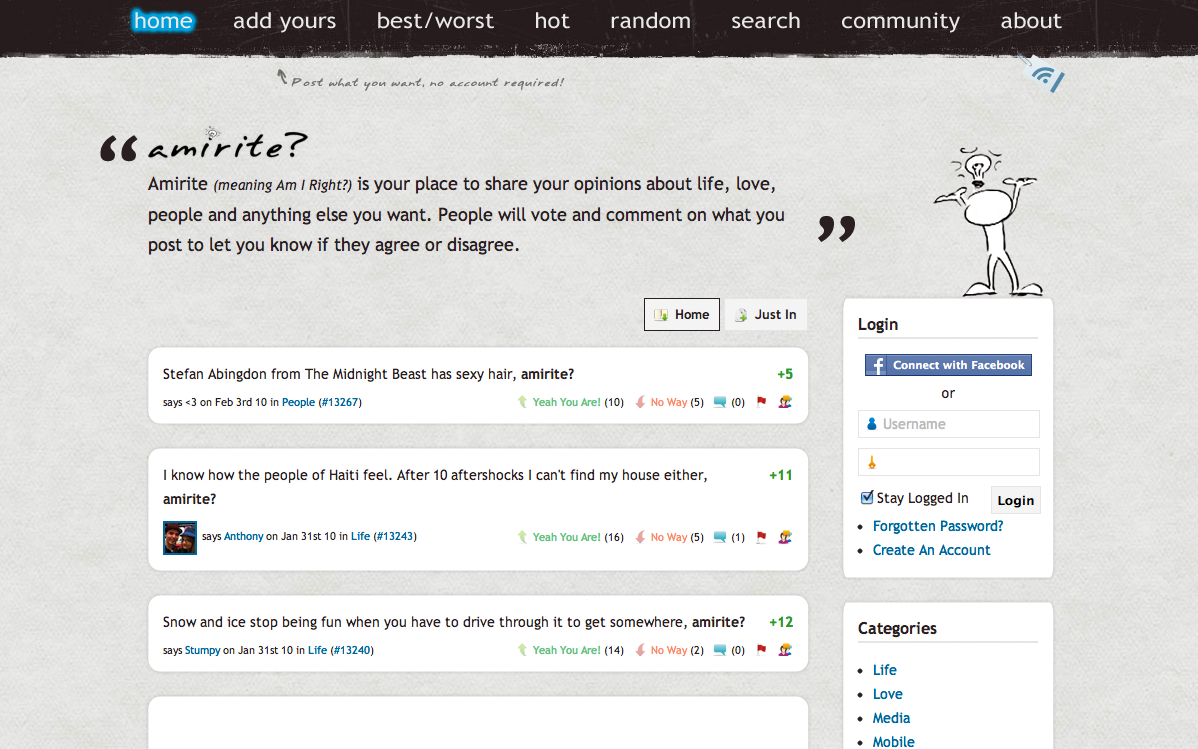
A social network for people to share opinions. It rapidly grew into one of the most popular and notable websites of its time.

My first commercial success. A service to exchange between virtual money providers such as PayPal, Moneybookers, and eGold. As featured in Mashable.